Observability using Open Telemetry in Go Application
Breaking down large monolithic applications and services into microservices has become a regular norm of today. This model focuses on small, loosely coupled, and independently deployable services. While this solves many issues, it also creates new ones. The Requests span across multiple services. Each service handles a request by performing one or more operations on them like updating databases, broadcasting the request further, etc. Implementing Monitoring and observability across this microservices architecture thus is critical to maintaining a healthy, usable system, or application.
Understanding Observability
In a microservices-based architecture, we have multiple services communicating with each other. Observability tools give the developers the power to observe how these services are actually interacting.
Observability uses instrumentation to provide insights that aids monitoring. In other words, monitoring is what you do after a system is observable.
An observable system helps understand and measure the internals of a system so that one can easily track development bugs and issues in a complex microservice architecture. It helps in understanding how each microservice processed the request and ultimately how close the current behavior of the system was to the expected one.
The Three Pillars Of Observability
There are usually three important pillars needed in any decent observability solution. These are:
1. Metrics
2. Logging
3. Tracing
By ensuring the implementation of these pillars, observability gives end to end picture of the complete microservices architecture.
Understanding Tracing
Tracing track the progression of a single request, called trace as it is handled by services that make up an application. The request may be initiated by a user or an application.
Distributed tracing is a form of tracing that traverses process, network, and security boundaries. Distributed tracing helps pinpoint where failures occur and what causes poor performance. While logs record important checkpoints when servicing a request, a trace connects all these checkpoints into a complete route that explains how that request was handled across all services from start to finish.
Each unit of work in a trace is called a span; a trace is a tree of spans. Spans are objects that represent the work being done by individual services or components involved in a request as it flows through a system.
A trace contains a single root span that encapsulates the end-to-end latency for the entire request. A trace is comprised of the single root span and any number of child spans, which represent operations taking place as part of the request. Each span contains metadata about the operation, such as its name, start and end timestamps, attributes, events, and status.

A span contains a span context, which is a set of globally unique identifiers that represent the unique request that each span is a part of. A span provides Request, Error, and Duration (RED) metrics that can be used to debug availability as well as performance issues.
SpanContext
Represents all the information that identifies Span in the Trace and MUST be propagated to child Spans and across process boundaries. A SpanContext contains the tracing identifiers and the options that are propagated from parent to child Spans.
- TraceId is the identifier for a trace. It is a unique combination of 32 randomly generated characters. TraceId is used to group all spans for a specific trace together across all processes.
- SpanId is the identifier for a span. It is a unique combination of 16 randomly generated characters. When passed to a child Span this identifier becomes the parent span id for the child Span.
- TraceFlags represents the options for a trace. It is represented by 2 characters.
- Tracestate carries tracing-system-specific context in a list of key-value pairs. Tracestate allows different vendors to propagate additional information and inter-operate with their legacy Id formats.
Lifecycle of a span
Generally, the lifecycle of a span resembles the following:
- A request is received by a service. The span context is extracted from the request headers if it exists.
- A new span is created as a child of the extracted span context; if none exists, a new root span is created.
- The service handles the request. Additional attributes and events are added to the span that is useful for understanding the context of the request.
- New spans may be created to represent work being done by sub-components of the service.
- When the service makes a remote call to another service, the current span context is serialized and forwarded to the next service by injecting the span context into the headers.
- The work being done by the service completes, successfully or not. The span status is appropriately set, and the span is marked finished.
Implementing tracing using Opentelemetry
Opentelemetry gives a solution that is portable, simple to implement, and with little performance overhead. OpenTelemetry is a collection of tools, APIs, and SDKs. You can use it to instrument, generate, collect, and export telemetry data (metrics, logs, and traces) for analysis in order to understand your software’s performance and behavior. The project provides a vendor-agnostic implementation that can be configured to send telemetry data to the backend(s) of your choice. It supports a variety of popular open-source projects including Jaeger, Zipkin, stdout, OTLP, and Prometheus.
To create and manage spans in OpenTelemetry, the OpenTelemetry API provides the tracer interface. This object is responsible for tracking the active span in your process and allows you to access the current span in order to perform operations on it such as adding attributes, events, and finishing it when the work it tracks is complete. One or more tracer objects can be created in a process through the tracer provider, a factory interface that allows for multiple tracers to be instantiated in a single process with different options.
Initializing Tracer Provider in Go Application
In our application, we have a tracer utility package that providers a tracer provider to the application based on the configurations in the application config file.

Within the application that intends to use this tracer utility, tracing is initialized using an initTracing function that returns a tracing object based on the tracing configuration.
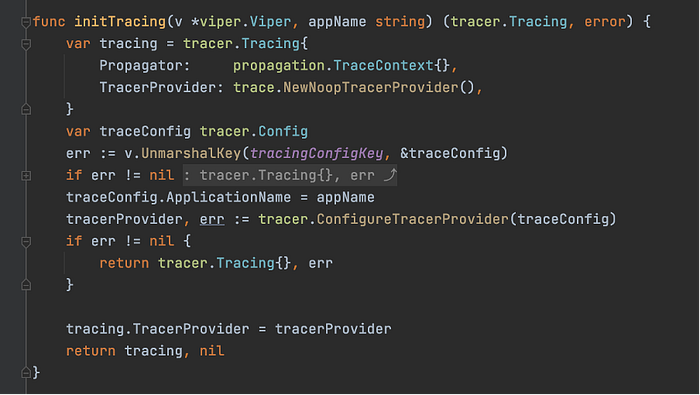
The providers/ exporters stdout, zipkin, jaeger, stdout, or noop can be enabled by just setting the same as a provider in the configuration. In case no configuration is provided, noop has been provided as Default Tracer Provider.

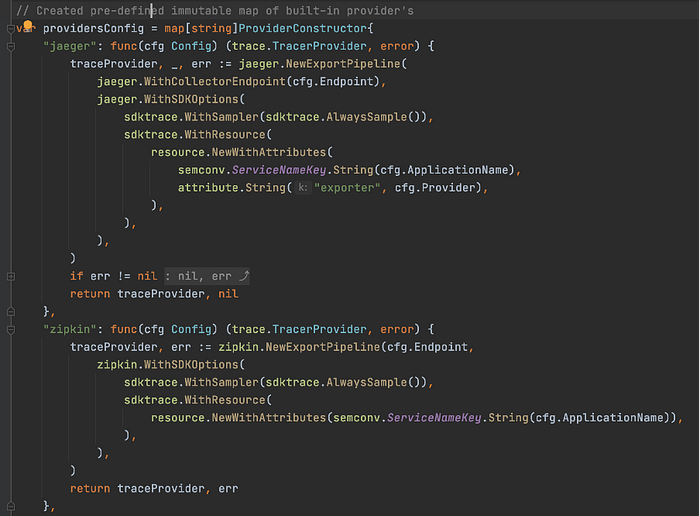
The configuration for initialization of each kind of provider or exporter is maintained as a map of the provider and the provider constructor function.

Instrumentation types
Automatic instrumentation
The best way to use Golang instrumentation is to include a supported library in your code. All these libraries can be instrumented by injecting the tracing provider object and propagator.
Manual instrumentation
If you’re using libraries that are not officially supported or in case you want to be very specific and granular with instrumentation, you can instrument your code manually using https://pkg.go.dev/go.opentelemetry.io/otel/api. Examples of using manual instrumentation can be found in https://github.com/open-telemetry/opentelemetry-go/tree/master/example
Implementation Details of Tracer Utility
The code for the tracer utility can be accessed here.
To understand and implement automatic instrumentation for Go Application, read our next article here.
Note: This article has been co-authored by Utsav Batra
References:
https://coralogix.com/blog/how-to-address-the-most-common-microservice-observability-issues/
https://thenewstack.io/monitoring-vs-observability-whats-the-difference/